Fault Properties
This page controls the display parameters for faults. You can select specific faults to be drawn as well as what part of the fault to be drawn.
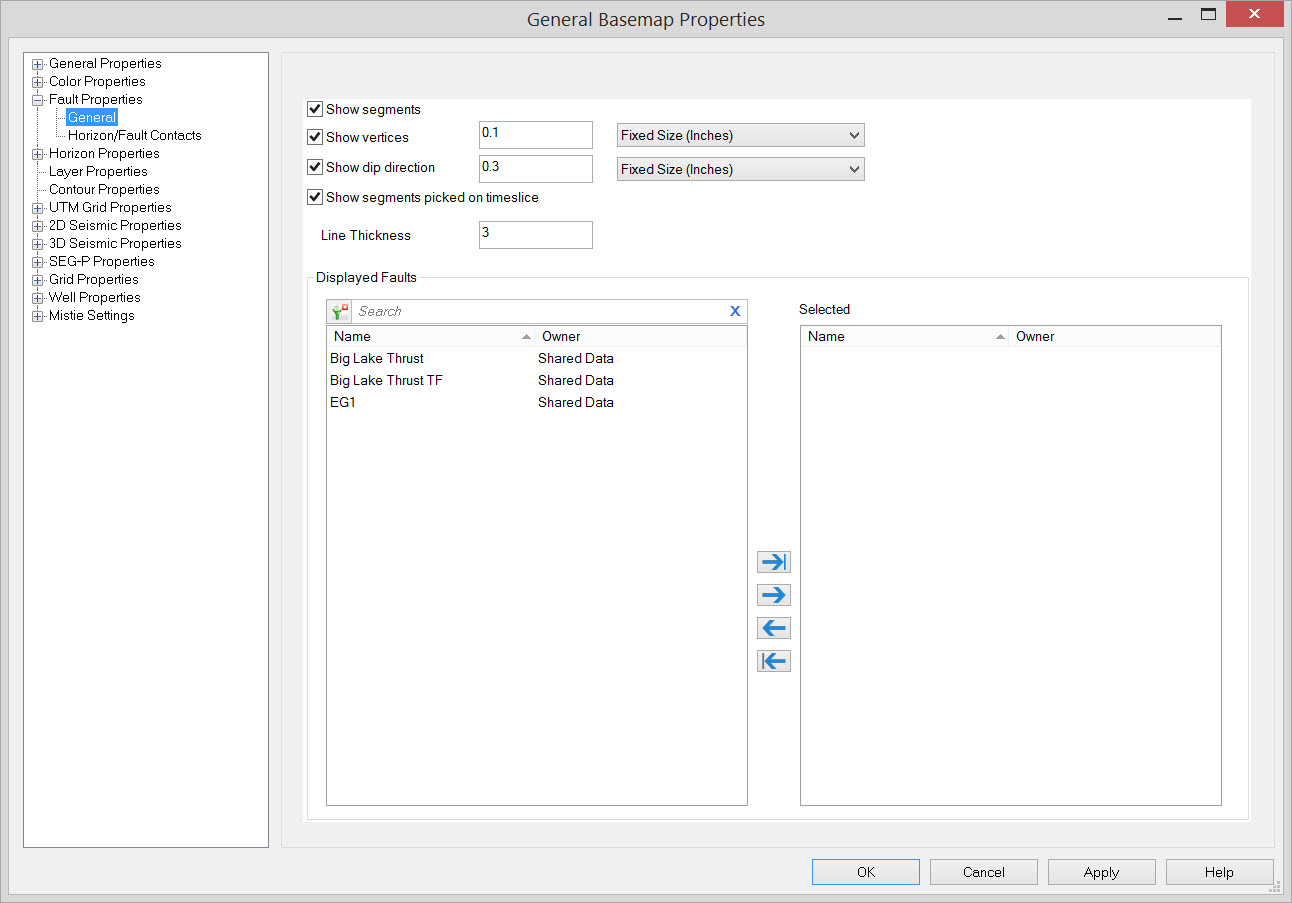
Enable Faults
Show Segments: Draw a line to represent each fault segment.
Show Vertices: Draw a box at every location that a node has been added when a fault segment was picked. Enter a size in the appropriate units. Fixed sized objects will remain the same regardless of the map scale. Variable sized objects will change size with the map scale.
Show Dip Direction: Draw an arrow head on the fault segment, showing the direction that the fault is dipping. Enter an arrow size in the appropriate units. Fixed sized objects will remain the same regardless of the map scale. Variable sized objects will change size with the map scale.
Show segments picked on timeslice: Draw fault segments picked on slices.
Fault Display Parameters
Line Thickness: Enter a value in pixels to determine the width of the fault segment and arrow lines. Note: Medium lines work best for printing.
Displayed Faults List
Select the faults that you want displayed on the Basemap. Left click to select a fault, or use the Ctrl key on your keyboard to select multiple faults, and then use the selection arrows to move the faults to the Selected list. Alternately, you can move a single fault to the Selected list by double clicking on it.
To help you make your selections, you can sort any column by left
clicking
on the column header, you can apply a filter (![]() ), or you can type a search
string
into the search
bar to limit the list using Name,
and Owner
information.
), or you can type a search
string
into the search
bar to limit the list using Name,
and Owner
information.
For additional selection and navigation options, right click on the list to access the shortcut menu.
Also See
— MORE INFORMATION

|
Copyright © 2020 | SeisWare International Inc. | All rights reserved |